IT Dashboards
IT Dashboards
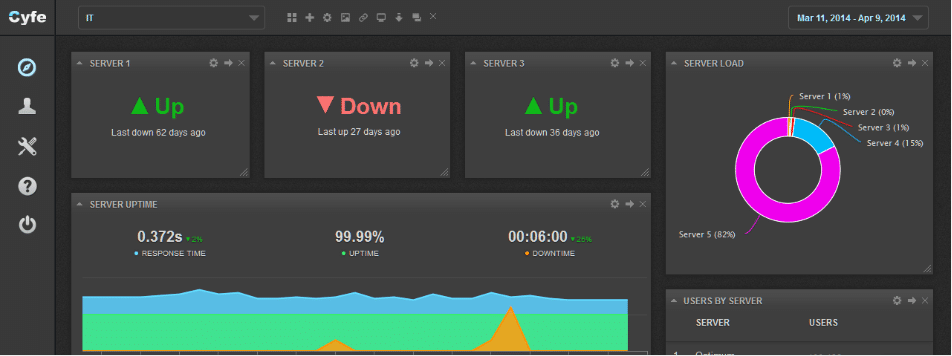
Sync up your technical applications with Cyfe to design IT Dashboards that allow you to monitor performance across your digital properties in real-time. Use the Cyfe Push API to optimize your IT performance with your custom SQL data.

Use real-time data and metrics to monitor how your organization is doing across all critical indicators that are important to you and your team, whether you want to track your sever loads, set up alerts and Pingdom checks, monitor traffic and data usage, and so much more!
With Cyfe, you always have the latest real-time data and metrics to track how your organization or clients are doing across any number of metrics (setup is a breeze, and add as many as you want with Cyfe Premium’s unlimited dashboards, widgets, and users. Not only do we provide prebuilt connectors for Pingdom, Chartbeat, AWS Cloudwatch, and RSS feeds, but you can use secure connectors to monitor the server data you’d like to visualize through our Custom widgets such as through as our open API, a secure private URL, or our SQL connectors.
Cyfe makes it quick & easy to automate your reporting, provide precise measurement on all aspects of your business, helping you monitor in real time how your sales are growing with our free dashboards. This means you can easily show your colleagues, executives, teammates, advisors, clients or your board how your projects are going, while saving you precious time and making your job effortless.
Not only does Cyfe securely centralize your proprietary metrics that you track through our Custom widgets, such as those in spreadsheets, your database, or through our open API, but we also have Google Analytics, Salesforce, Xero, Quickbooks, Adwords, Facebook, Twitter and dozens of prebuilt integrations that give you easy-to-use, real-time dashboards for social media, clients, marketing, finance, SEO, project management, sales, startups, and much more, making Cyfe the best all-in-one online dashboard for all of your organization’s analytics.