With modern consumers gravitating online for most of their shopping needs and the ease of setting up an online store, the eCommerce industry is booming at a mind-boggling pace.
In 2017, eCommerce was responsible for $2.3 trillion in sales, and this number is expected to nearly double to $4.5 trillion by 2021. And by 2040, it is estimated that 95% of purchases will be made online, according to Kinsta.
However, cashing in on this multi-trillion dollar industry isn’t as straightforward. Running an eCommerce business, you’re working hard to ensure you have an appealing and functional website that renders a great user experience (UX). You’re also toiling away to drive a steady stream of traffic to your store using various strategies like content marketing, social media advertising, and more.
Even so, at the end of the day, the success of your online venture comes down to whether or not you convert your site’s visitors into customers. Because if your hard-earned traffic doesn’t convert, then there’s essentially no return on your investment.
Now, as you’d expect, your product pages play a pivotal role in converting traffic into customers. The product page is one of the final steps towards a purchase, and the quality of your product pages can make or break your business.
And so, let’s take a look at the key ingredients that make for a high-converting product page, along with the key performance indicators (KPIs) for measuring its performance. But first, let’s start by talking about the eCommerce product page metrics.
Table of Contents
Key eCommerce Performance Metrics
The foundation of any successful eCommerce business is the ability to track and harness performance metrics to make data-driven decisions.
While there are many metrics you can track and optimize, you only need to focus on a few key metrics that make the biggest impact on your store’s growth, such as:
Sales
The most important metric of them all that needs no introduction. All the optimizations you do on your store, including product pages, ties to boosting sales.
Average Customer Order
More commonly known as Average Order Value (AOV), it refers to the average amount of money customers spend in a single transaction. To calculate it, simply divide the total value of all sales (your revenue) with the total number of orders.
Of course, you want your customers to spend as much as they can on your online store, so the higher the AOV, the better. Tracking your AOV on a dashboard enables you to set benchmarks and work out how to get people to spend more with every purchase.
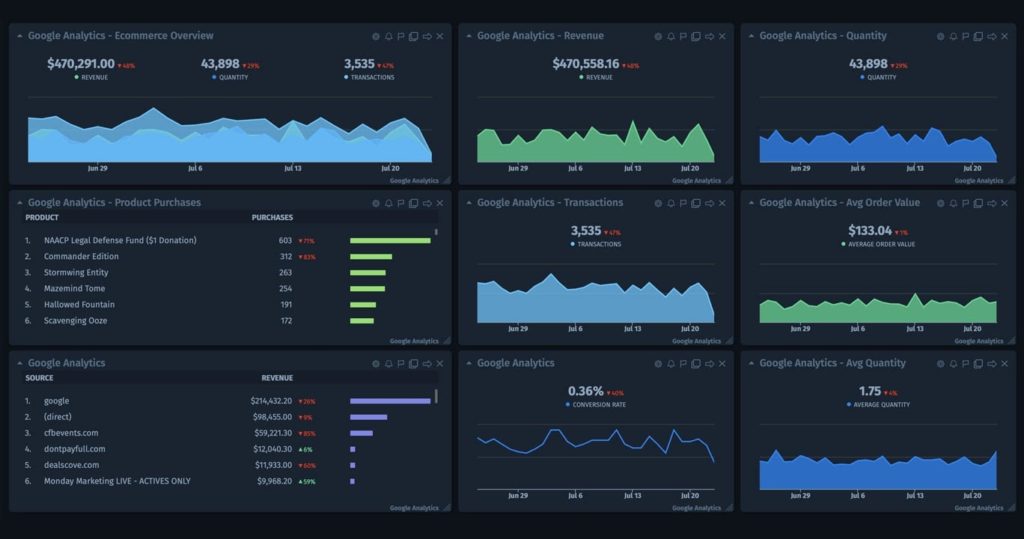
Here are a few ways to boost your AOV:
- Upsell your customers by encouraging them to purchase a comparable higher-end product or cross-sell by recommending complementary products that improve the usability of their primary purchase.
- Bundle related products so customers get a small discount while increasing their order value.
- Offer free shipping on order values above a certain threshold to compel customers to maximize their spending.
Customer Acquisition Cost
Increasing your AOV is crucial, but it’s only half of the equation. Your Customer Acquisition Cost (CAC) refers to the average cost of acquiring one customer, which includes everything from the cost of running paid ad campaigns to paying your marketing team.
So if you’re spending an average of $20 to acquire each customer but your AOV is only $15, it means your business is operating at a loss.
To turn that into profit, you must optimize your acquisition channels so you only pay for quality traffic that’s more likely to convert. Assess which channels make the biggest difference for your business and double down on them.
Customer Lifetime Value
Customer Lifetime Value (CLV) is the total amount you earn from a customer over the length of their relationship with you.
So if a customer makes five transactions at your store over their lifetime, each averaging $50, your CLV would be $250. However, you have to minus the acquisition cost from this number.
Your CLV serves as a benchmark for the maximum amount you can spend to acquire customers and the efforts you should make to retain them. That said, it typically costs less to keep a customer than it does to acquire a new one, which means increasing the value of existing customers over their lifetime is crucial.
Boosting your CLV is all about increasing the AOV and creating loyalty programs to turn one-time customers into repeat ones.
Simply put, CLV is a critical metric as the more your customers spend — and the more often they do — the better it is for your store’s growth.
Key Ingredients of a High-Converting Product Page
With the key performance metrics clearly defined, it’s time to dive into the four key ingredients that make for a high-converting product page. Let’s go.
Optimized Product Visuals
Like it or not, customers do judge a book by its cover, especially when they can’t feel, taste, or try out your products first-hand before making a decision.
So, to give your prospects a clearer sense of your products, and to build trust and minimize cart abandonment rate, you must reassure them that they are making the right decision — by uploading high-quality product visuals.
Here are a few important visual formats you need to use:
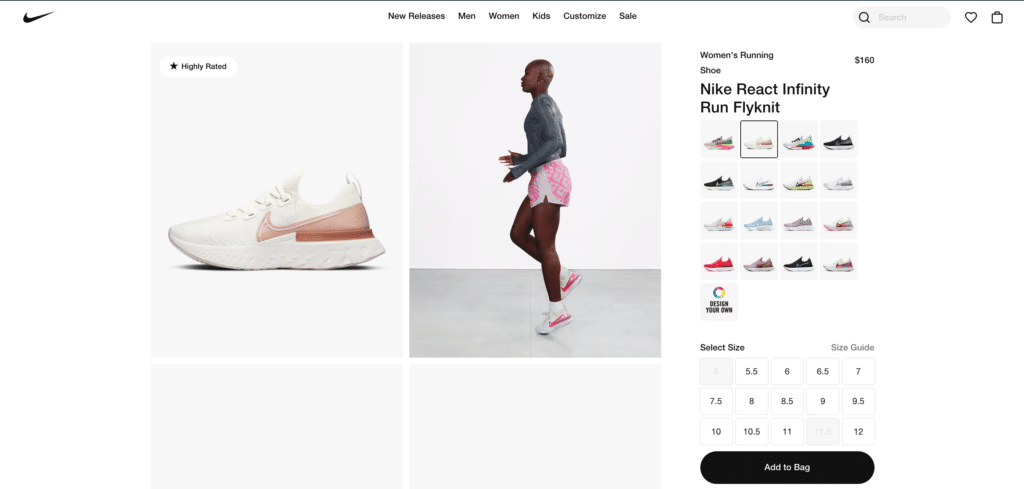
- Primary product images: High-resolution, professional photographs of your product against a white background. These images allow your shoppers to view the product without any distractions. Try to upload multiple primary images from various angles.
- Lifestyle images: This involves showcasing your products as they’re being used in real-life situations by owners. Such images help your prospects visualize what it would be like to own your product.
- Instructional illustrations: These are short graphics highlighting the best features of your product. It can also be a “how-to” illustration (for assembly or usage instructions) proving the product’s ease-of-use.
- Videos: A short clip explaining the product or its use in real-life situations.

Source: Amazon
Furthermore, it’s absolutely critical to optimize your images for speed. High-resolution, full-sized images are often bulky and would slow down your page’s load speed, which, in turn, would negatively impact not just your shopper’s experience but also your site’s rankings on Google.
So, use any of the free image optimization tools to compress your product visuals while maintaining quality. Also, have an alt text for each image so they’re more accessible to visually-impaired users and search engine crawlers.
Don’t cut corners when it comes to product visuals by uploading so-so images taken on your smartphone. Hire a professional — it’ll pay dividends in the long run.
Crisp Product Copy
The next key ingredient of your product page is the copy, aka product description. If you’re selling something useful and exciting, why not write a crisp copy that encourages the prospect to take prompt action.
Use a clear structure and hierarchy in your product’s description — with subheadings, bullets, and keywords to make your copy scannable, enable visitors to quickly find the answers to their questions, and improve your page’s rankings on Google.
Make sure you don’t write an extremely wordy description full of minute details. Only highlight all the details, benefits, and features that matter. Leave the technical or tedious details for the product manual.
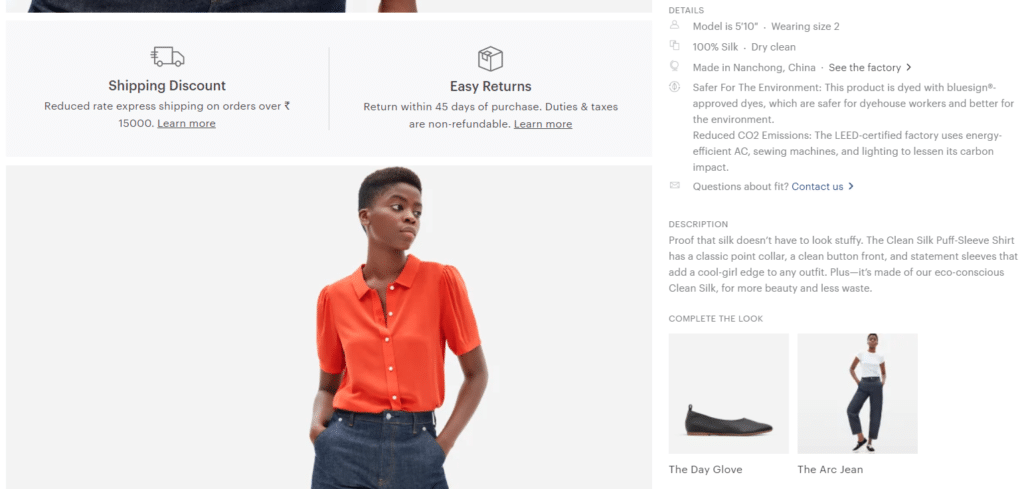
Source: Everlane
Keep the following guidelines in mind to write a strong product copy:
- Explain your product’s unique value proposition, or why people should pick your product and not your competitors’.
- Describe the benefits of your product and the problems that it solves.
- Anticipate and address any potential doubts or concerns.
- Reduce buyer hesitation and boost confidence by specifying any guarantees or warranties.
- Include keywords but don’t stuff them. Readability is key.
- Avoid jargon. Use bullets, keep the language simple, and sentences short.
Compelling Call to Action (CTA)
Your end goal is to make people click on the “Add to Cart” button and lead them to the checkout process. For that, the button itself should be inviting and super clickable.
Here’s how to design a compelling CTA:
- Use a contrasting color that matches your brand’s theme to make it stand out from other elements on the page.
- Make it big enough so it’s easily spotted within the first three seconds of landing on the product page.
- Don’t clutter the area surrounding the button and have sufficient white space.

Source: Old Navy
Besides, as most shoppers are going to be indecisive or hesitant, it’s a good idea to also have a “Save for Later” or “Add to Wishlist” button to keep them in the funnel and allow them to easily complete their purchase later.
Abundant Social Proof
Social proof, in the form of product reviews and customer testimonials, is indispensable to your store’s success. Simply put, social proof plays a key role in building buyer confidence.
In fact, 66% of consumers trust online reviews as much as recommendations from family and friends. What’s more, 69% of online shoppers want more reviews from eCommerce sites, and 77% of customers read product reviews before making a purchase.
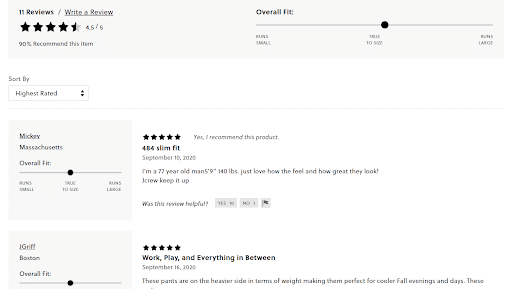
Source: J.Crew
Clearly, the number and quality of product reviews you’re able to showcase on your product page can be the deciding factor between a sale or a bounce.
A great way to garner more reviews is to reach out to your customers via email (a week after the purchase) and request them to take a moment to write an honest review.
As there’s nothing in it for them, you can also incentivize their feedback by offering them discounts and rewards on their next purchase. This way, you also increase customer retention and brand loyalty.
You’ll likely also receive negative reviews, which you can use to improve your offerings and show your customers that you value their opinions.
Framework for Measuring and Optimizing Product Page Performance
Now that you’re aware of what makes for an effective product page, let’s see what product page metrics you need to measure and how you can improve the performance of your page by tweaking various elements.
KPIs for Product Page performance
Here are five essential product page KPIs you must track on your eCommerce dashboard.
Add-to-Cart Rate
The add-to-cart rate is the percentage of product page visitors who have clicked the “Add to cart” or “Buy” button and added the product to their shopping cart.
To calculate your add-to-cart rate, divide the number of sessions that have resulted in the product being added to the customer’s cart with the total number of sessions, and then multiply it by 100.
This metric gives you an idea of whether you’re attracting the right audience and if your visitors know what they need to do once they arrive on your product page. It’s also a good indicator of how your product and its price point align with your customer’s expectations.
Conversion Rate
Your conversion rate shows how effective your product page is at converting visitors into customers. It’s a crucial metric you need to track in your Google Analytics eCommerce dashboard.
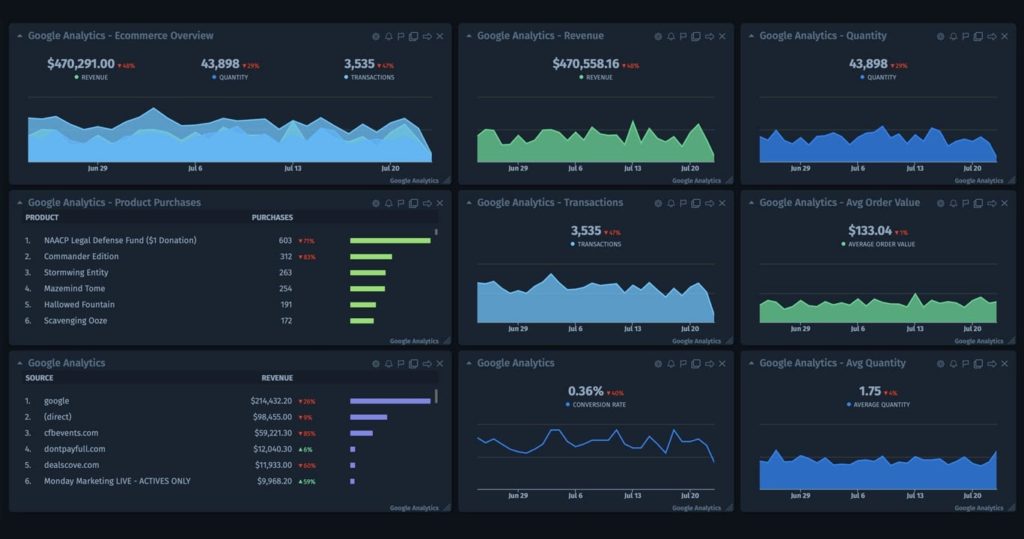
It’s calculated by dividing the number of product sales by the total number of visitors over a particular period. In essence, you’re extending the add-to-cart rate to accommodate the efficiency of your checkout process.
Cart Abandonment Rate
Cart abandonment rate is a metric that indicates the percentage of visitors that have added your product to their cart during a session and then left your store without completing their purchase.
According to Baymard Institute, the average cart eCommerce cart abandonment rate is 69.57%.
There are countless reasons why visitors ditch their carts — high shipping fees, a complicated checkout process, no returns policy, lack of desired payment method, or being forced to create a full-fledged account, to name a few.
Tracking your cart abandonment rate on a dashboard allows you to figure out potential reasons for abandonment and optimize the checkout process.
Bounce Rate
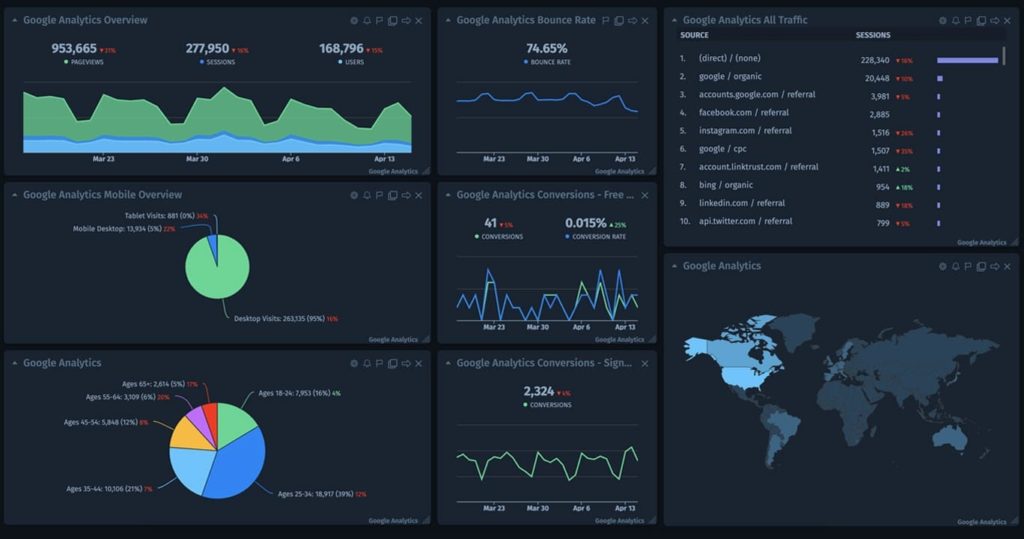
The bounce rate is the percentage of visitors who leave your website (“bounce”) without visiting any additional pages besides the produce page where they landed.
If you have a high bounce rate on a particular product page, it signals potential issues such as slow page loading speed, difficult navigation, or lack of mobile responsiveness. So, make sure to track your bounce rate in your Analytics dashboard.
Time on Page
This metric shows how much time visitors are spending on your product page. It is calculated by dividing the total time visitors have spent on a page by the number of visitors who’ve visited the page over a specified period.
Time on page gives you an idea of how engaging your page’s content is, and how it aligns with visitors’ expectations.
While a higher time spent on page usually means your content is engaging, you don’t want it to be too high as it could mean that visitors aren’t sure what they need to do to complete the purchase or are too hesitant to make a purchase.
Tweaking Ingredients and Optimizing Performance
While all the best practices discussed above are cogent in theory, every business and target audience is unique. The only surefire way to optimize your product page for maximum conversions is to continuously test and iterate.
That is, it’s a good idea to invest efforts in continuously split testing the key ingredients outlined above. Essentially, split (also known as A/B) testing is the process of splitting your traffic into two (or more) variations of your product page to see which performs better.
The main constituents of an A/B test are variants — the two versions of the page, the champion, the original page, and the challenger, or the modified version of the page that you compare against the original.
For instance, you can split the traffic between two versions with different product descriptions for a couple of weeks, and see which one converts better. Likewise, you can test image and CTA variations (different size, color, text, etc.) to see if the challenger version performs better. If it does, replace the champion page with the “winner” and repeat the process until you reach your target conversion rate.
An important thing to note is that you must split test one element at a time, otherwise, you won’t know which element’s variation brought in the results. And while you can go about this manually, an efficient approach would be to use one of the many A/B testing tools available today.
Over to You
The product page is the gateway to final conversion, so it’s vital to make it as frictionless as possible.
Crafting a high-converting product page involves a lot of moving parts, but working on the key ingredients outlined above — product visuals, copy, CTAs, and reviews — along with a focus on measuring and improving KPIs on a custom dashboard, is a surefire way to drive more conversions.
