As a sales manager, you know the entire organization relies on you to be able to forecast revenue.
And while there are dozens of sales metrics you can check, you need to track the most insightful and actionable data points. Then you need a way to be able to quickly see both your team and individual sales metrics so you can drive results.
In this article, I’ll share eight key sales performance metrics to monitor. Plus, how you can quickly keep your team and organization updated on your results.
Table of Contents
How to Monitor and Report On Sales Metrics
1. Average Deal Size
The average deal size is the average sales price of all closed deals for a given period.

A salesperson’s average deal size might be lower than the rest of their team for a range of reasons:
- Not following up quickly with responsive leads
- Providing discounts to every closed lead
- Prioritizing larger, harder-to-win deals, taking time away from more predictable leads
In reviewing this sales metric by representative, there can be plenty of coaching opportunities to improve underperforming team members.
2. Win Rate
Win rate, also known as lead conversion rate, is the percentage of leads that become customers.

Let’s say you have 250 leads come in per month. If an average of 25 leads buys your product, your team’s win rate is 10%.
Win rate helps you evaluate your sales process so you can see:
- Where qualified leads drop off in your funnel
- How much the win rate varies by team member
- Whether the win rate of an individual rep is lower because they are contacting too many unqualified leads
- If moving your sales team remote affected your lead conversion rates
This sales metric also helps you estimate how many leads you need to generate to hit your monthly team quota. Let’s say your team’s monthly sales quota is $500,000 and the average deal size is $2,000. You can take that sales quota and divide it by average deal size to see you that need to close 250 leads.
Then if your win rate is 10%, you’ll need 2,500 leads per month.
As you fine-tune your sales process, you should see your team’s win rate increase. If it doesn’t, you may have an issue within your sales funnel or individuals on your team.
The one major exception: your win rate may decrease if you move upstream (such as from mid-market to enterprise sales).
You can track your win rate in most sales-oriented CRMs such as Salesforce.
3. Sales Pipeline Coverage
Your sales pipeline is your team’s total sales opportunities. But you can put this sales metric to better use to set your reps up for success by tracking your sales pipeline coverage (SPC). Sales pipeline coverage is a sales metric that helps you determine if your team has enough opportunities to hit revenue targets.
To determine sales pipeline coverage: take the sum of all your pipeline opportunities and divide it by the quota goal.

If your team has $500,000 in sales opportunities and your revenue goal is $500,000, you’ve got 1x pipeline coverage.
High performing sales teams may be able to still hit their quotas with coverages on the lower end. However, your pipeline coverage should be anywhere from 3x to 5x.
4. Time Spent Selling
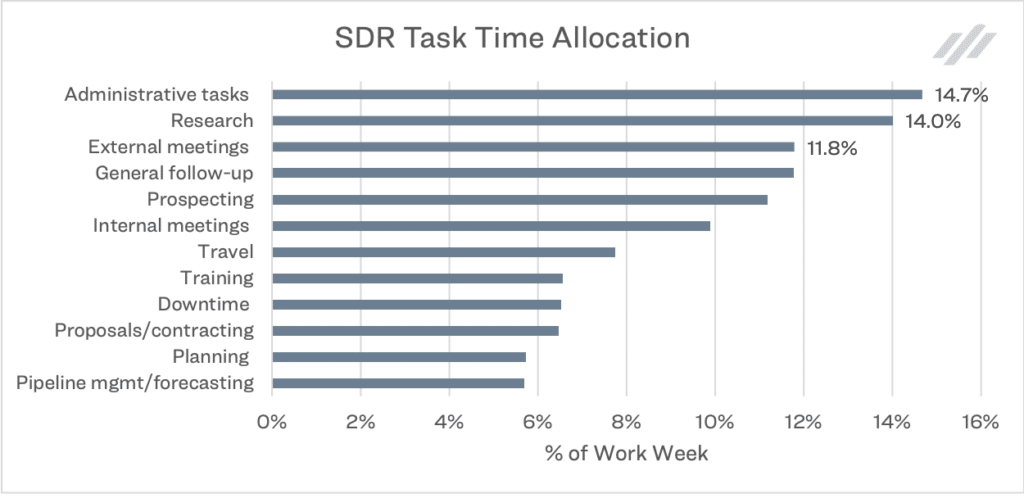
A XANT study found that only 33.2% of sales reps’ time goes directly towards selling.

Time spent selling factors in the amount of time spent on external meetings, follow-up, and prospecting.
For measuring this sales metric, many sales automation and CRM platforms offer time tracking features.
If you’re looking to increase your team’s time spent directly selling, consider hiring a coordinator for research and other tasks. Or data enrichment solutions to help you find out more about leads like Clearbit.
Look at ways also to improve internal processes to help them be more efficient. On an individual basis, if you see time spent selling as a low outlier, spend a sitdown meeting reviewing how their processes might vary and coach the rep on how to streamline their actions further.
5. Sales Cycle
The sales cycle is the average amount of time it takes to close a deal. Along with calculating the length of the overall sales cycle, you’ll also want to track how long the individual stages in your sales process take.
By placing benchmarks by stage and overall sales cycle, you can:
- Identify the most likely to buy active leads based on how long they’ve been in your sales funnel
- Callout leads stuck in specific stages for longer periods of time
- Optimize specific processes so sales stages take less time than previous sales periods
6. Monthly Sales Growth
As you know, you can’t just forecast future sales — you need to show month-to-month growth.
Beyond commissions, you and your entire team benefit from monthly sales growth:
- Your company’s founder and any C-Suite executives can see clear monthly results
- Sales reps can see their efforts make a difference
- Sales managers can make the case to hire more reps or increase your team’s resources
Monthly sales growth as a sales metric measures the increase or decrease in sales month-over-month. To calculate monthly sales growth, take last month’s sales minus the prior month’s sales. Then take that number and divide by the previous period sales. Multiply that figure by 100 to get the percent increase or decrease in monthly sales growth.

So if your team produced $100,000 two months ago and last month generated $200,000, that’s 100% month-over-month growth.
Beyond motivating your sales team, monthly sales growth lets you see what’s encouraging (or discouraging) revenue including new processes and product features.
7. Lead Response Time
The longer it takes your team to respond to inquiries, the more likely you’re missing that opportunity.
One study found firms that attempted to contact potential customers within an hour of receiving a query were almost seven times as likely to qualify the lead than those that waited even an extra hour. For teams that waited 24 hours or longer, they were 60 times less likely to make the sale.
Depending on your CRM, the process to track lead response time varies. You’ll need to stack Google Sheets and Zapier with HubSpot. For Salesforce, you can use an app like Response Time Tracker.
After tracking lead response times, you can potentially see how your lead response time impacts conversion rates. Then share with your team the results to incentivize them even further to get back to their leads faster.
8. Additional Revenue Opportunities
Yes, revenue is your team’s north star. But there are many different ways to review revenue to uncover growth, customer value, and retention.
You likely want to monitor:
- New business: the direct impact your sales team made by seeing the amount of revenue from new business
- Upsell rates: the percentage of customers who purchase another product or upgrade to a higher-tier package
- Retention rates: the percentage of customers who renew their contracts
And if you’re selling a subscription service, you’re probably already looking at monthly recurring revenue (MRR) and the amount of revenue you expect to review each year (annual recurring revenue or ARR).

As you gather each of these sales performance metrics, you or your sales manager may decide to prioritize retention, upselling, or other strategies to see the bottom-line impact over the next quarter.
How to Monitor and Report On Sales Metrics
Imagine this: Walking into your next one-on-one with your VP of Sales, you hold your head up high. You know you have the right data to support new revenue opportunities. You can clearly show the huge results your team’s delivering. The strategy and metrics are all in place so it’s easy to get your bonus.
Or even unlock data-backed coaching opportunities so every rep is meeting their full potential.
Now you can do each of these by setting up a sales dashboard.

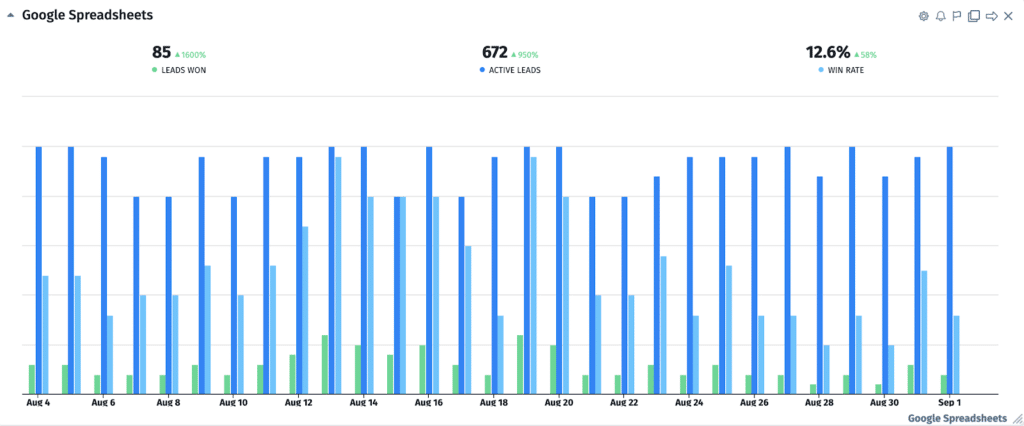
Cyfe’s dashboards integrate with HubSpot, Google Sheets, Salesforce, and many other platforms so you can easily plug in your data and keep your organization updated on the most important results your team’s delivering.
Then set up alerts, so you receive notifications by email or SMS when your data meets specific conditions. And share major changes with your team in real-time.
Summing It Up
It can feel like a whirlwind trying to wrangle data and figure out what metrics to prioritize.
Fortunately, your business goals can help you identify the right sales performance metrics. After you’ve identified your KPIs, keeping track of your team and individual rep’s performance becomes much easier with a dashboard.
By prioritizing the most actionable sales metrics to your team you can provide data-backed coaching and make the case for your team to earn more based on their individual performance.
You can also fix the biggest bottlenecks in your sales funnel and processes, setting yourself up to share huge results that can pay dividends throughout the rest of your career.


